Free template
Which of your projects actually make money?
Most agencies can name their biggest project. Almost none can name their most profitable one. This sheet fixes that in an afternoon.
Ask an agency owner what a project billed and you get an answer in five seconds. Ask what it cost and you get a pause and a guess. The hours are in a timesheet, the contractor bill is in your inbox, the ad spend is on a card statement... so “that one went well” stays a feeling instead of a number.
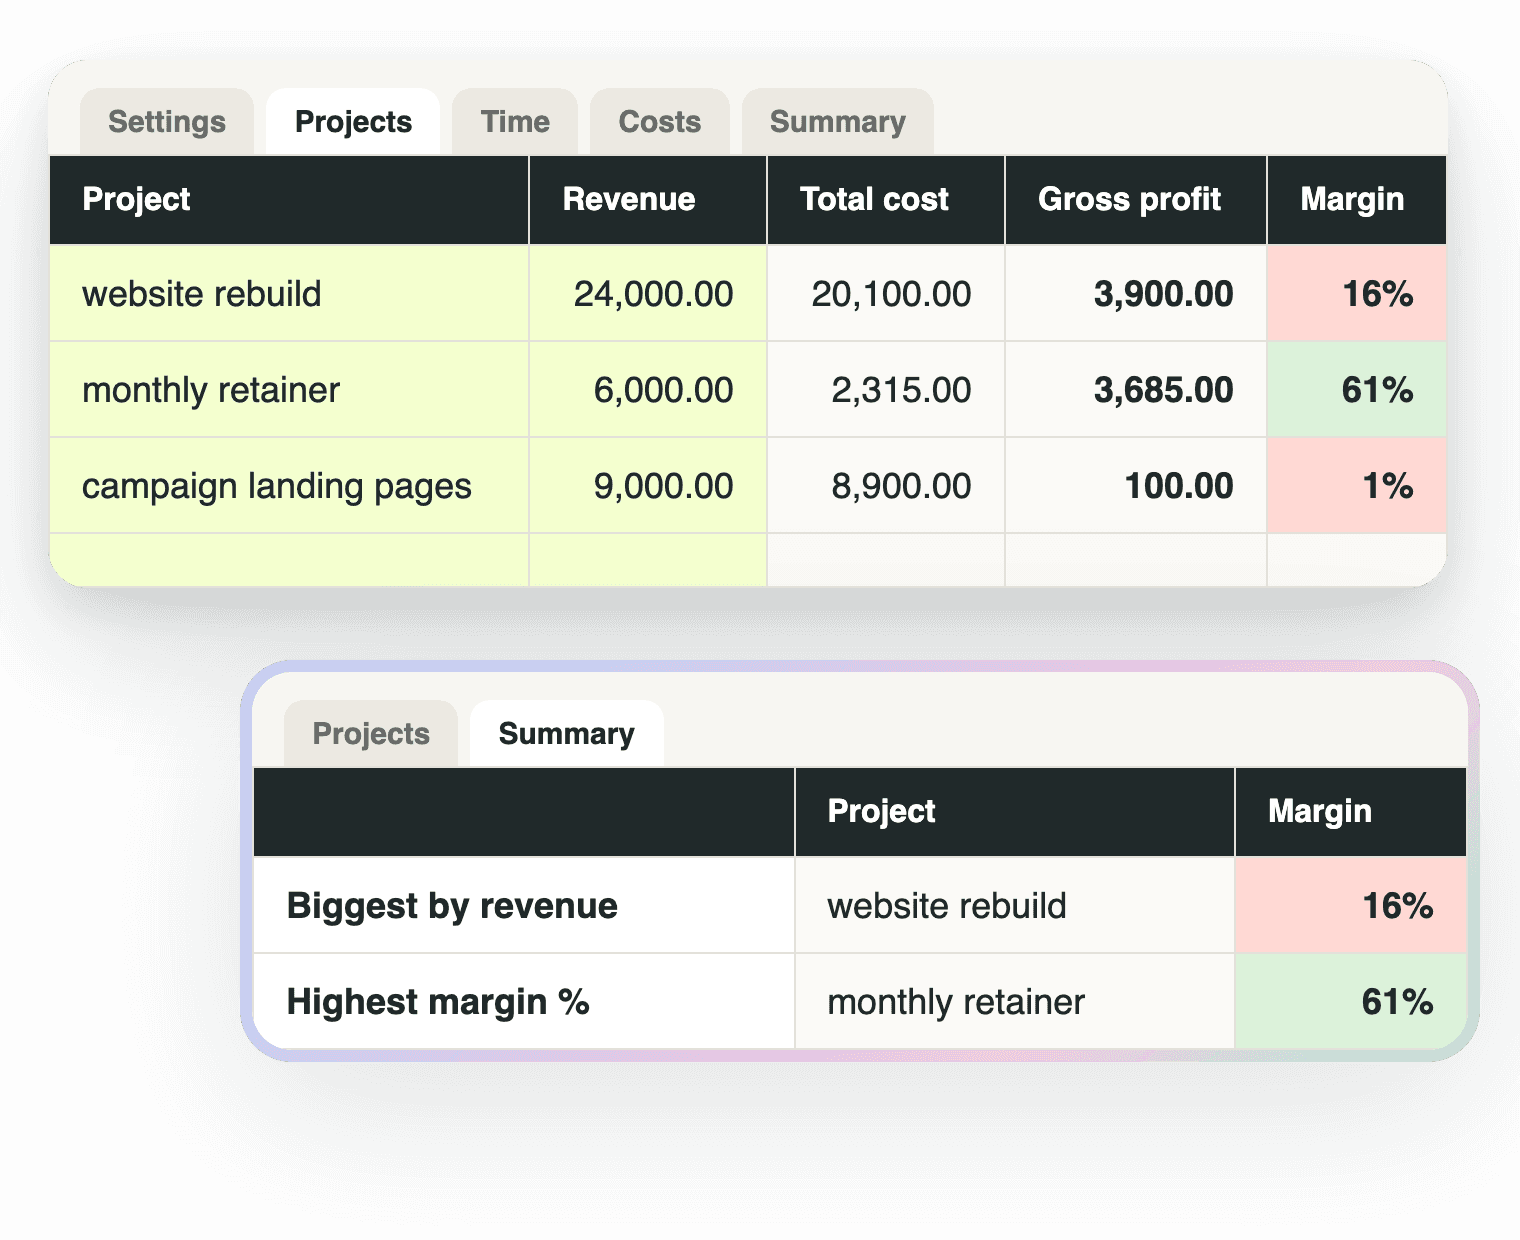
This is one workbook that puts every cost next to the revenue it ate. One row per project, live gross margin, effective hourly rate, and a Summary tab that lines up your biggest project against your most profitable one. They’re usually not the same project.
What’s inside
Start here
How to use it in eight lines, and the one caveat that matters.
Settings
Your roles and what each one costs you per hour, your target margin, your currency. Everything else reads from here.
Projects
One row per project: revenue, invoiced, paid, then labour, contractor, software, media and other costs, gross profit, margin (red, amber or green against your target), effective hourly rate and what's still outstanding.
Time
Hours per project per role. Cost works itself out from your Settings rates. 200 rows.
Costs
Every contractor bill, software seat, ad spend or other cost against the project it belongs to. 200 rows, filterable.
Summary
Biggest project vs most profitable project side by side, projects ranked by profit and by margin, total outstanding, blended effective hourly rate. All formulas, nothing to fill in.
The same view, live
The sheet is the manual version
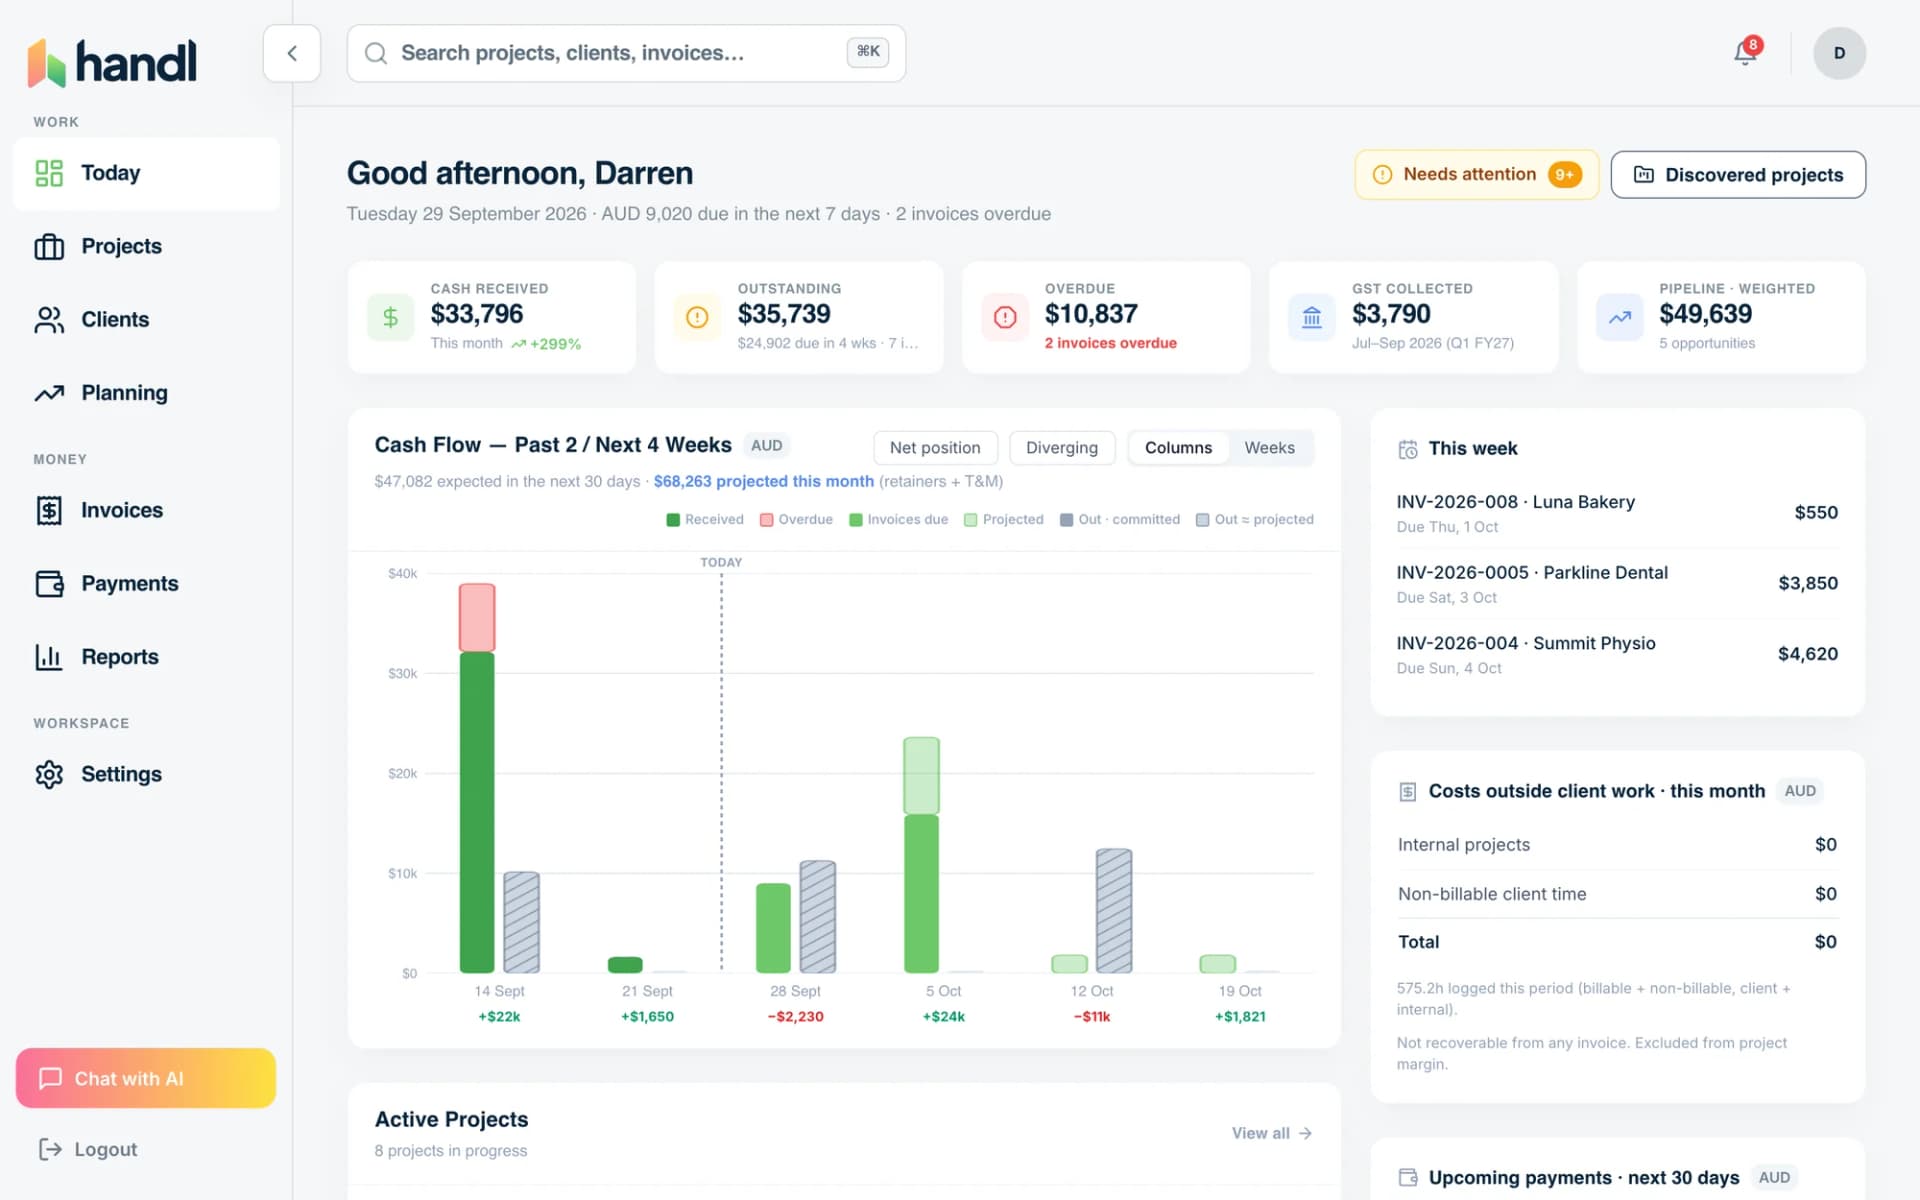
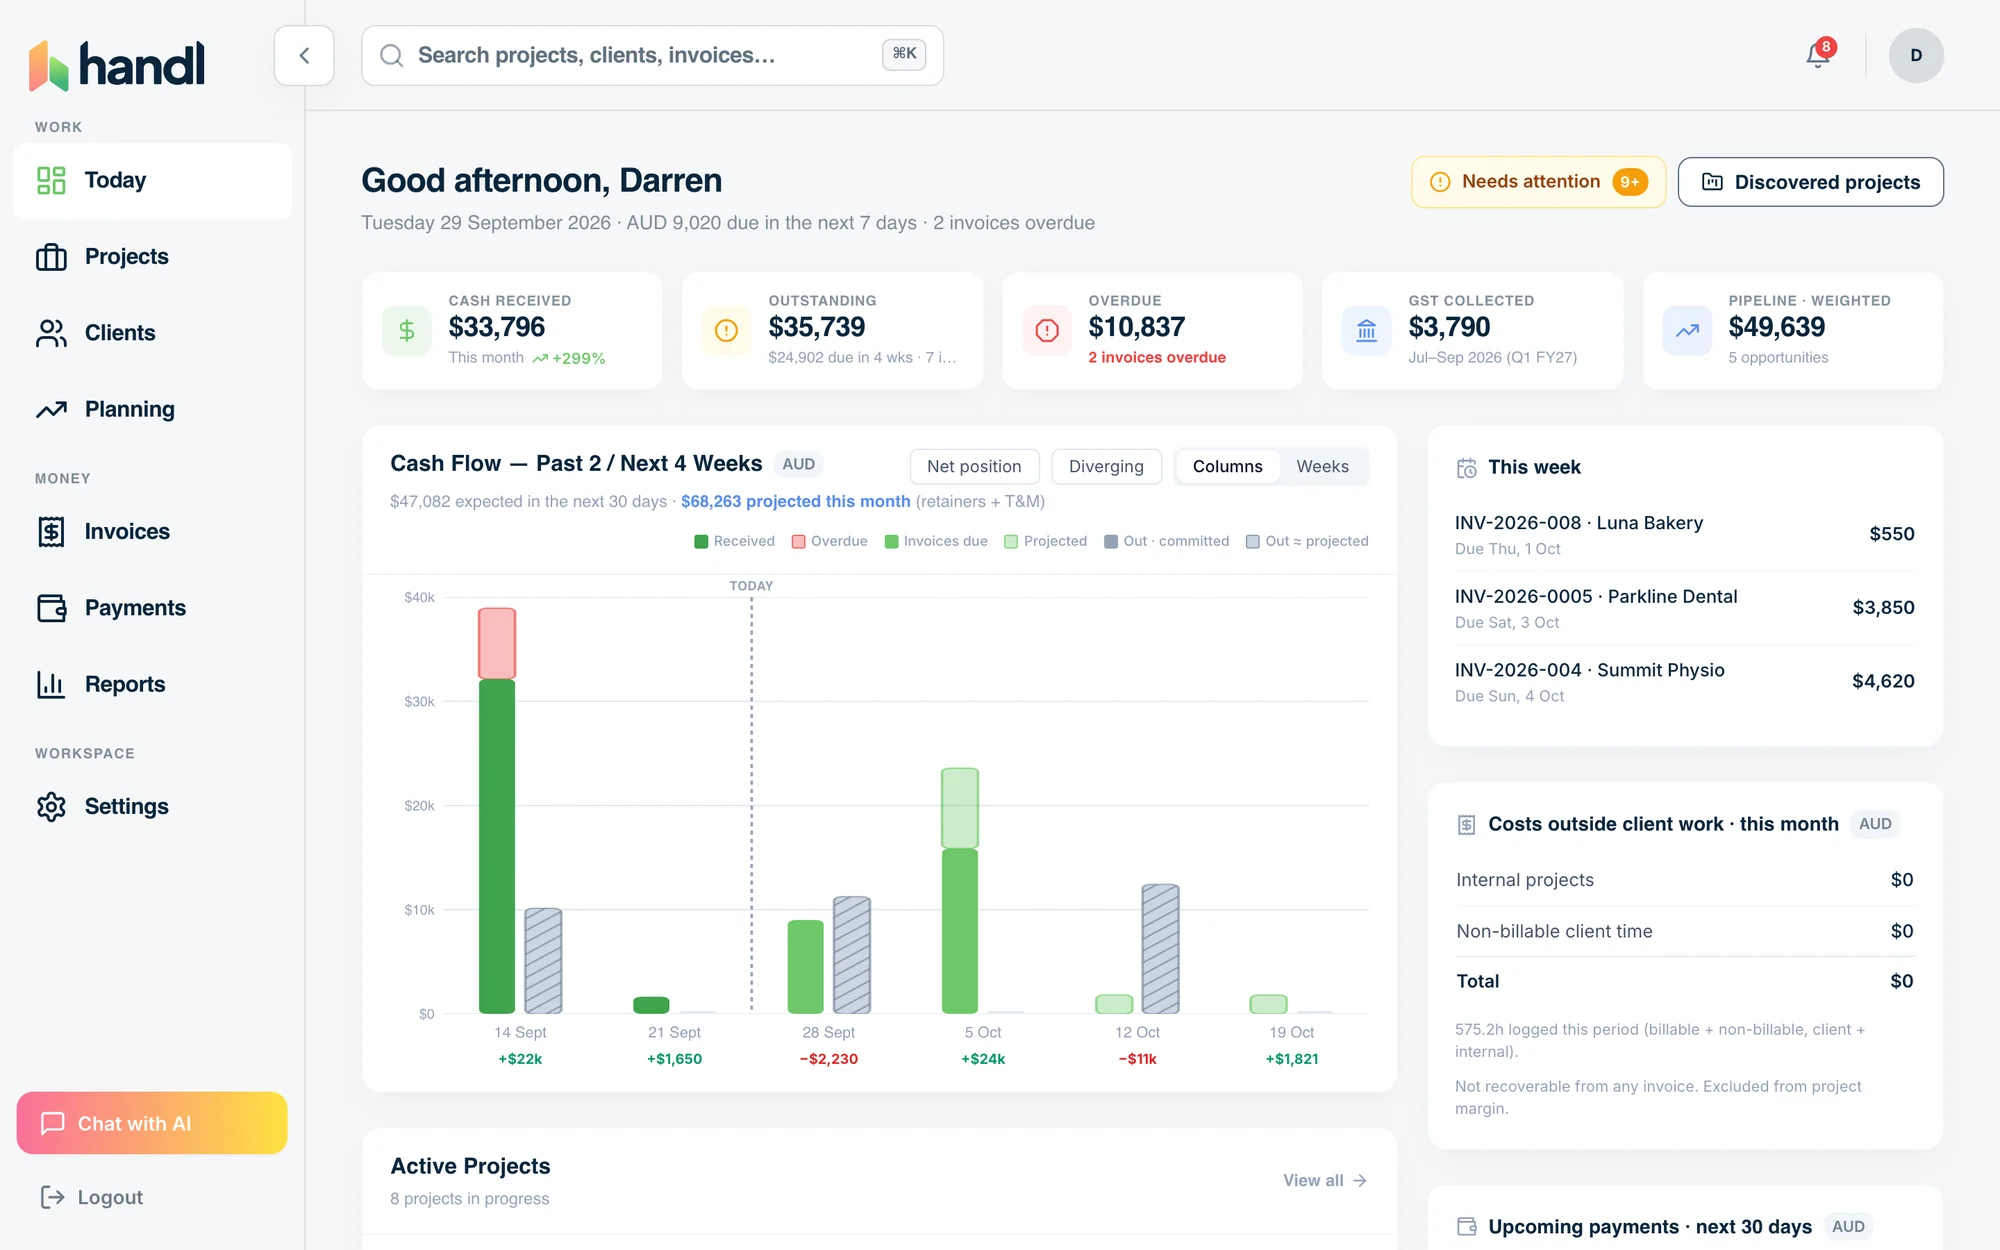
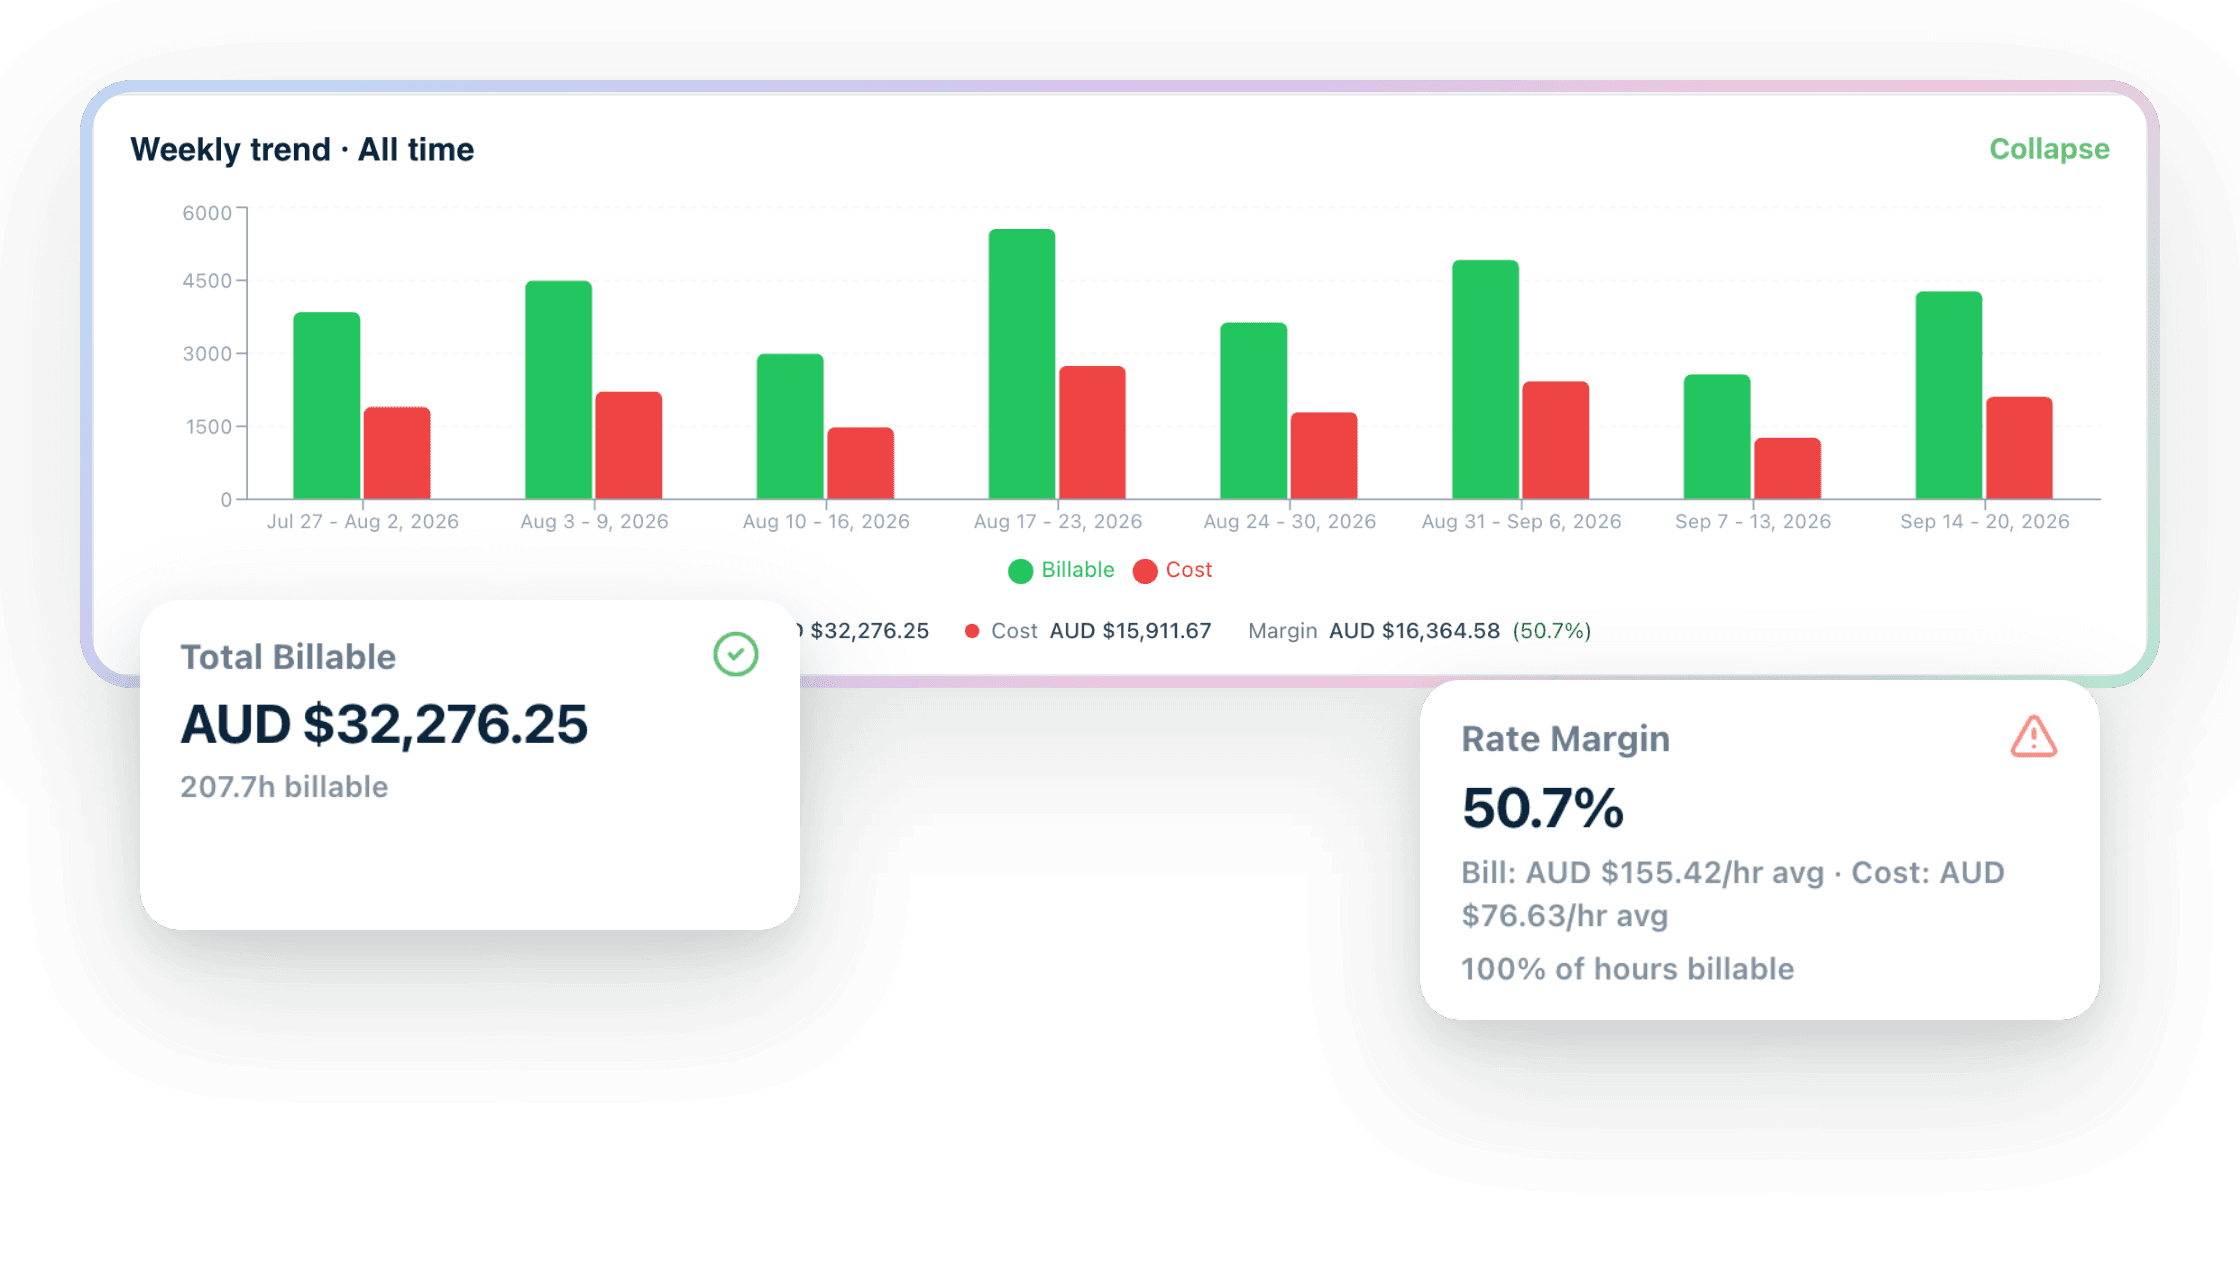
In Handl every project shows what it billed against what it cost, week by week, labour and hard costs together, with the margin badged green, amber or red. The profitability report then lines your projects up by margin, so “which ones actually make money?” is a glance, not an afternoon.
Start with the sheet. When you’re tired of keeping it up to date, the numbers are already waiting in Handl.
Worth knowing
Delete the example rows before you start
The three rows marked Example (and their Time and Costs rows) are there to show how the formulas hang together. Clear them, put your roles and rates in Settings, then add projects one at a time. Fill last quarter’s first: the Summary tab gets interesting at three projects, not one.
For the thinking behind the sheet, read the agency project profitability guide.
Free download
Get it free
Drop your email and the workbook lands in your inbox. The download link is on screen too, so you're not waiting on email.
Not accounting advice, and it won't replace your accountant. It'll tell you which project to look harder at.

Reclaim your time
Stop being your own debt collector.
Get paid faster with automated invoicing and reminders.